Introduction:
If you’ve spent any time watching candlestick charts, you’ve noticed the market never moves in a straight line. It rises while falling and falls while rising. It looks like chaos — but what if that chaos follows a repeating psychological pattern? That’s exactly what Elliott Wave Theory proposes. In this guide, you’ll learn the theory from zero, master its three inviolable rules, and get a free Pine Script indicator to spot market pivots on TradingView.
What Is Elliott Wave Theory?
Developed by Ralph Nelson Elliott in the 1930s, the theory states that financial markets move in cycles driven by mass psychology. When investors are optimistic, prices rise in waves; when fear takes over, prices correct.
Elliott’s great insight was that these movements form fractal patterns — structures that repeat themselves within themselves across different timeframes. The same shape you see on a weekly chart appears on the 15-minute chart, just smaller.
The Classic 5-3 Structure
In the basic model, a complete trend is made of 8 waves divided into two phases:
- Impulse phase (with the main trend): 5 waves, numbered 1, 2, 3, 4 and 5.
- Corrective phase (against the main trend): 3 waves, labeled A, B and C.
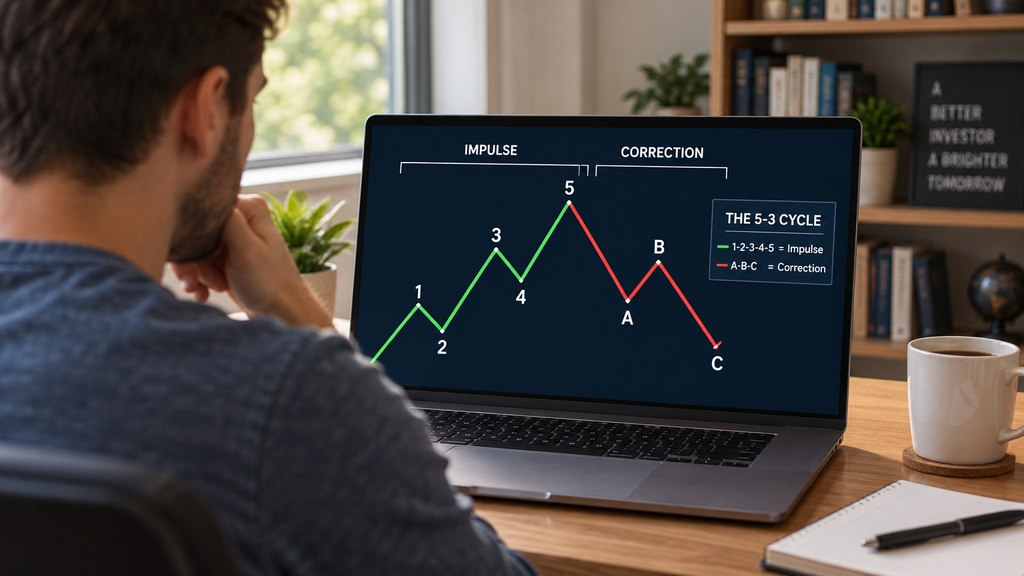
Educational diagram of the 5-3 cycle, impulse waves and correction. AI-generated image.
Meet the Waves
- Wave 1: The initial move. Usually a timid rally while the market still believes the price fell too much.
- Wave 2: Profit-taking. Price pulls back — but never below the start of Wave 1.
- Wave 3: The traders’ favorite. The strongest and longest wave. Everyone notices the trend and jumps in.
- Wave 4: A sideways or shallow pullback. Part of the profit is taken, but optimism remains.
- Wave 5: The final top. Driven by euphoria — and often by late-arriving news. The general public buys the top out of pure FOMO.
- Waves A, B, C: The market’s hangover. Price starts melting (A), attempts one last weak rally (B), then drops in the final correction (C).
Three Golden Rules (Inviolable)
To count waves like a professional, memorize these three rules. If any one of them breaks, your count is wrong:
- Wave 2 never retraces more than 100% of Wave 1. It cannot make a new low below the start of the cycle.
- Wave 3 is never the shortest of the three impulse waves (1, 3 and 5). Usually, it’s the largest.
- Wave 4 never enters the price territory of Wave 1. The bottom of Wave 4 cannot overlap the top of Wave 1.

Panel featuring the three golden rules, superimposed on a chart. AI-generated image.
The Perfect Marriage: Elliott Waves + Fibonacci
If Elliott Waves are the map showing where you are, Fibonacci tools are the compass calculating how far the market will travel. In practice, we use two tools: retracement (to measure corrections) and projection (to measure impulses).
Measuring corrections (Fibonacci Retracement):
- Wave 2 is usually deep, correcting between 50% and 61.8% of Wave 1. If price holds that zone with buying strength, you’ve found a gold mine.
- Wave 4 is shallower and sideways, typically respecting the 38.2% level of Wave 3 (rarely reaching 50%).
Projecting profit targets (Fibonacci Projection):
- Wave 3 target: the classic projection is 161.8% of Wave 1’s size. In euphoric markets (like crypto), stretching to 261.8% is not rare.
- Wave 5 target: project Wave 1’s size from the bottom of Wave 4. The common final top lands at 61.8% or 100% of that measure.

Fibonacci levels on the chart, with targets for each wave. AI-generated image.
💡 Trader’s tip: plot the retracement on Wave 1; if price holds exactly at 61.8%, your entry trigger fires the moment price breaks above Wave 1’s top. Your final target: the 161.8% projection. Simple, mathematical and highly visual.
Free TradingView Indicator: ZigZag Pivot Tracker
Spotting these waves by eye is hard at first. This Pine Script indicator connects the market’s significant highs and lows, filters out the noise and numbers the waves automatically — making the Elliott structure much easier to see. Open the Pine Editor at the bottom of TradingView, paste the code and click “Add to chart”:
//@version=5
indicator("Elliott Blog - ZigZag Wave Counter", overlay=true)

// ── User settings ─────────────────────────────────────────────
depthInput     = input.int(10, minval=1, title="Depth (Lookback Candles)")
deviationInput = input.float(5.0, minval=0.1, title="Minimum Deviation (%)")

// ── Confirmed pivots ──────────────────────────────────────────
ph = ta.pivothigh(high, depthInput, depthInput)
pl = ta.pivotlow(low, depthInput, depthInput)

newPivotPrice  = na(ph) ? pl : ph
newPivotIsHigh = not na(ph)
pivotBar       = bar_index - depthInput

// ── ZigZag + wave counting state ─────────────────────────────
var float  lastPrice  = na
var int    lastBar    = na
var bool   lastIsHigh = na
var int    seqIdx     = 0
var line   lastLine   = na
var label  lastLabel  = na

var string[] waveLabels = array.from("1", "2", "3", "4", "5", "A", "B", "C")

farEnough = na(lastPrice) or math.abs(newPivotPrice - lastPrice) / lastPrice * 100 >= deviationInput
sameType  = not na(lastIsHigh) and newPivotIsHigh == lastIsHigh

if not na(newPivotPrice) and farEnough
    if sameType
        // Same direction as last pivot: extend it instead of stacking labels
        line.set_xy2(lastLine, pivotBar, newPivotPrice)
        label.set_xy(lastLabel, pivotBar, newPivotPrice)
        lastPrice := newPivotPrice
        lastBar   := pivotBar
    else
        string waveTxt = na
        if na(lastIsHigh)
            // First pivot: a low opens the cycle, a high already counts as Wave 1
            waveTxt := newPivotIsHigh ? array.get(waveLabels, 0) : "0"
            seqIdx  := newPivotIsHigh ? 1 : 0
        else
            waveTxt := array.get(waveLabels, seqIdx % 8)
            seqIdx  += 1
        bool isCorrection = waveTxt == "A" or waveTxt == "B" or waveTxt == "C"
        if not na(lastBar)
            lastLine := line.new(lastBar, lastPrice, pivotBar, newPivotPrice, color=color.red, width=2)
        lastLabel := label.new(pivotBar, newPivotPrice, waveTxt, style=newPivotIsHigh ? label.style_label_down : label.style_label_up, color=isCorrection ? color.new(color.orange, 20) : color.new(color.red, 20), textcolor=color.white, size=size.normal)
        lastPrice  := newPivotPrice
        lastBar    := pivotBar
        lastIsHigh := newPivotIsHigh
Technical note: the indicator labels each confirmed pivot automatically, following the Elliott sequence 1-2-3-4-5 for impulse waves and A-B-C for corrections (impulse labels in red, correction labels in orange). “Minimum Deviation” is the percentage move needed to draw a new leg, while “Depth” is how many candles the script looks back to confirm a pivot. The count is structural — it follows the alternation of highs and lows — so always confirm the three golden rules before trading a wave count.
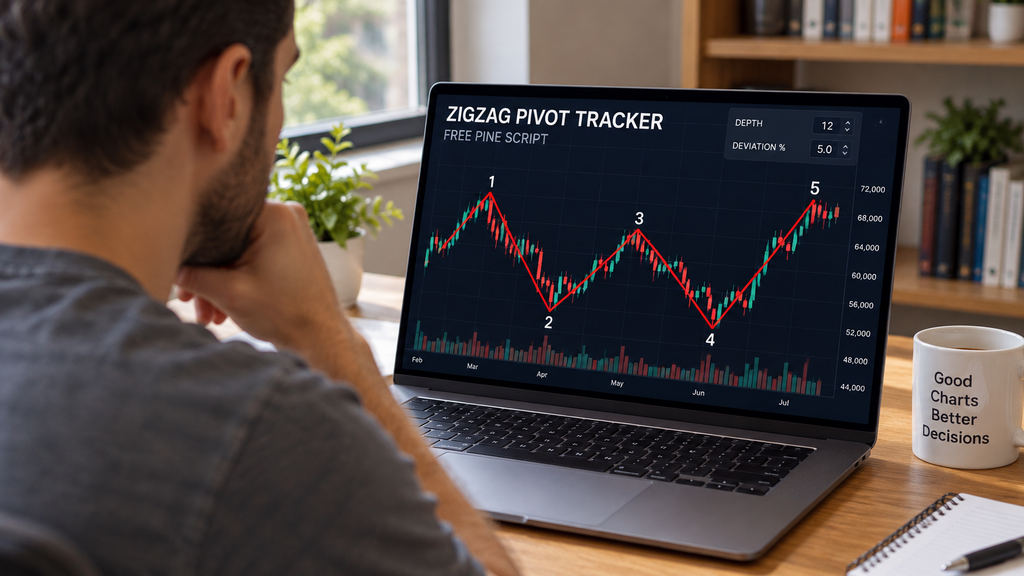
TradingView with the ZigZag indicator plotted over candlesticks. AI-generated image.
How to Apply It in Your Trading
- Trade Wave 3: wait for Wave 1 to form and Wave 2 to correct. When price breaks above Wave 1’s top, the Wave 3 trigger has fired — your best buying opportunity.
- Let Fibonacci be your best friend: Wave 2 usually retraces 50–61.8% of Wave 1; Wave 3 usually projects 161.8%.
- Manage your risk: if you buy the Wave 3 breakout, your stop loss goes right below the bottom of Wave 2. Remember rule number one!
Final Thoughts
Mastering Elliott Wave Theory takes screen time and patience — but reading the market through this lens puts you miles ahead of most beginner traders. Use the indicator above to train your eye on historical charts, count the waves, and watch how mass psychology repeats.
Which asset will you analyze first with Elliott Waves? Drop a comment below!

