
1. Free Trading Indicators
Welcome to our free indicators library. Every tool on this page is written in Pine Script for TradingView, ready to copy and paste. No signup, no cost, no catch.
Each indicator combines classic technical analysis concepts into a single, clean chart. Below you will find the code, the installation steps and the recommended settings.

Home office desk with a monitor showing the 34 EMA Wave indicator with market clock, patterns and support and resistance lines. AI-generated image.
2. 34 EMA Wave + Patterns + S/R + Panel
Based on the 34 EMA Wave setup popularized by futures trader Raghee Horner, this indicator combines four tools in one script:
- The 34 EMA Wave: three exponential moving averages of 34 periods (highs, closes and lows) forming a channel around the price.
- The Market Clock: automatic background coloring showing the current phase — green for uptrend, gray for sideways, red for downtrend — plus a live panel in the top-right corner.
- Candlestick patterns: automatic detection of Hammer, Shooting Star, Bullish and Bearish Engulfing, Doji, Three White Soldiers and Three Black Crows, with on-chart labels. Each pattern has its own on/off toggle.
- Support and Resistance: automatic horizontal lines drawn from confirmed pivot highs and lows, with adjustable sensitivity.
How to install:
- Open your chart on TradingView and open the Pine Editor panel at the bottom.
- Paste the code below, click Save and then Add to chart.
- Open the settings (gear icon) to toggle patterns and adjust the S/R sensitivity. For the 1-hour chart, use a pivot lookback of 15 to 20.
//@version=5
indicator("34 EMA Wave + Patterns + S/R + Panel", shorttitle="34 Wave+", overlay=true, max_lines_count=100, max_labels_count=200)

// ===== Inputs =====
emaLen      = input.int(34,  "EMA length", minval=1)
slopeLen    = input.int(3,   "Slope lookback (bars)", minval=1)
pivotLen    = input.int(15,  "S/R pivot lookback (bars) - use 15-20 for 1H", minval=2)
srMaxLines  = input.int(6,   "Max S/R lines on chart", minval=1, maxval=50)
showSR      = input.bool(true, "Show support/resistance lines")

// Pattern toggles (individual)
showHammer  = input.bool(true, "Hammer")
showStar    = input.bool(true, "Shooting Star")
showBullE   = input.bool(true, "Bullish Engulfing")
showBearE   = input.bool(true, "Bearish Engulfing")
showDoji    = input.bool(false, "Doji")
showTWS     = input.bool(true, "Three White Soldiers")
showTBC     = input.bool(true, "Three Black Crows")

// ===== 34 EMA Wave =====
emaH = ta.ema(high, emaLen)
emaC = ta.ema(close, emaLen)
emaL = ta.ema(low,  emaLen)

p1 = plot(emaH, "EMA 34 (High)",  color=color.new(color.red, 30))
p2 = plot(emaC, "EMA 34 (Close)", color=color.new(color.orange, 0), linewidth=2)
p3 = plot(emaL, "EMA 34 (Low)",   color=color.new(color.green, 30))
fill(p1, p3, color=color.new(color.blue, 88), title="Wave channel")

// Market clock phases
slopeUp   = emaC > emaC[slopeLen]
slopeDown = emaC < emaC[slopeLen]
aboveWave = close > emaH
belowWave = close < emaL

bullPhase = aboveWave and slopeUp
bearPhase = belowWave and slopeDown
sidePhase = not bullPhase and not bearPhase

bgcolor(bullPhase ? color.new(color.green, 85) : bearPhase ? color.new(color.red, 85) : color.new(color.gray, 92))

// ===== Candlestick patterns =====
body      = math.abs(close - open)
range_    = high - low
lowerWick = math.min(open, close) - low
upperWick = high - math.max(open, close)

isHammer   = range_ > 0 and lowerWick >= body * 2 and upperWick <= body * 0.5 and body > 0
isStar     = range_ > 0 and upperWick >= body * 2 and lowerWick <= body * 0.5 and body > 0
prevRed    = close[1] < open[1]
prevGreen  = close[1] > open[1]
bullEngulf = prevRed and close > open and close >= open[1] and open <= close[1]
bearEngulf = prevGreen and close < open and open >= close[1] and close <= open[1]
isDoji     = range_ > 0 and body <= range_ * 0.1

tws = close > open and close[1] > open[1] and close[2] > open[2] and
      close > close[1] and close[1] > close[2] and
      body > range_ * 0.5 and body[1] > range_[1] * 0.5 and body[2] > range_[2] * 0.5

tbc = close < open and close[1] < open[1] and close[2] < open[2] and
      close < close[1] and close[1] < close[2] and
      body > range_ * 0.5 and body[1] > range_[1] * 0.5 and body[2] > range_[2] * 0.5

if showHammer and isHammer
    label.new(bar_index, low, "HAMMER" + (bullPhase ? " ▲" : ""), style=label.style_label_up, color=color.new(color.green, 20), textcolor=color.white, size=size.small, yloc=yloc.belowbar)

if showStar and isStar
    label.new(bar_index, high, "STAR" + (bearPhase ? " ▼" : ""), style=label.style_label_down, color=color.new(color.red, 20), textcolor=color.white, size=size.small, yloc=yloc.abovebar)

if showBullE and bullEngulf
    label.new(bar_index, low, "ENGULF" + (bullPhase ? " ▲" : ""), style=label.style_label_up, color=color.new(color.green, 20), textcolor=color.white, size=size.small, yloc=yloc.belowbar)

if showBearE and bearEngulf
    label.new(bar_index, high, "ENGULF" + (bearPhase ? " ▼" : ""), style=label.style_label_down, color=color.new(color.red, 20), textcolor=color.white, size=size.small, yloc=yloc.abovebar)

if showDoji and isDoji
    label.new(bar_index, high, "DOJI", style=label.style_label_down, color=color.new(color.gray, 20), textcolor=color.white, size=size.tiny, yloc=yloc.abovebar)

if showTWS and tws
    label.new(bar_index, low, "3 SOLDIERS" + (bullPhase ? " ▲" : ""), style=label.style_label_up, color=color.new(color.green, 10), textcolor=color.white, size=size.small, yloc=yloc.belowbar)

if showTBC and tbc
    label.new(bar_index, high, "3 CROWS" + (bearPhase ? " ▼" : ""), style=label.style_label_down, color=color.new(color.red, 10), textcolor=color.white, size=size.small, yloc=yloc.abovebar)

// ===== Support and Resistance (pivot-based) =====
ph = ta.pivothigh(high, pivotLen, pivotLen)
pl = ta.pivotlow(low, pivotLen, pivotLen)

var array<line> srLines = array.new<line>()

f_addSR(price, isRes) =>
    l = line.new(bar_index - pivotLen, price, bar_index, price, extend=extend.right, color=isRes ? color.new(color.red, 40) : color.new(color.green, 40), style=line.style_dashed, width=1)
    array.push(srLines, l)
    if array.size(srLines) > srMaxLines
        line.delete(array.shift(srLines))

if showSR and not na(ph)
    f_addSR(ph, true)
if showSR and not na(pl)
    f_addSR(pl, false)

// ===== Market clock panel =====
var table panel = table.new(position.top_right, 1, 2, border_width=1, border_color=color.new(color.white, 70))

if barstate.islast
    phaseText  = bullPhase ? "UPTREND  (12-2h)" : bearPhase ? "DOWNTREND (4-6h)" : "SIDEWAYS (2-4h)"
    phaseColor = bullPhase ? color.new(color.green, 25) : bearPhase ? color.new(color.red, 25) : color.new(color.gray, 40)
    table.cell(panel, 0, 0, "MARKET CLOCK", text_color=color.white, bgcolor=color.new(color.blue, 30), text_size=size.small)
    table.cell(panel, 0, 1, phaseText, text_color=color.white, bgcolor=phaseColor, text_size=size.small)
Want the full guide?
Read our complete article: How to Day Trade Crypto with the 34 EMA Wave Setup — it covers the market clock, entry rules, stop placement and risk management in detail.
More indicators coming soon
We are building this library over time. New Pine Script indicators will be added here as they are released, always free and always with full documentation.
3. Wyckoff Cycle Detector + EMAs — User Manual
Platform: TradingView (Pine Script v5) Type: Overlay indicator Based on: Richard Wyckoff’s four-phase market cycle, combined with a triple exponential moving average system (8 / 21 / 55)
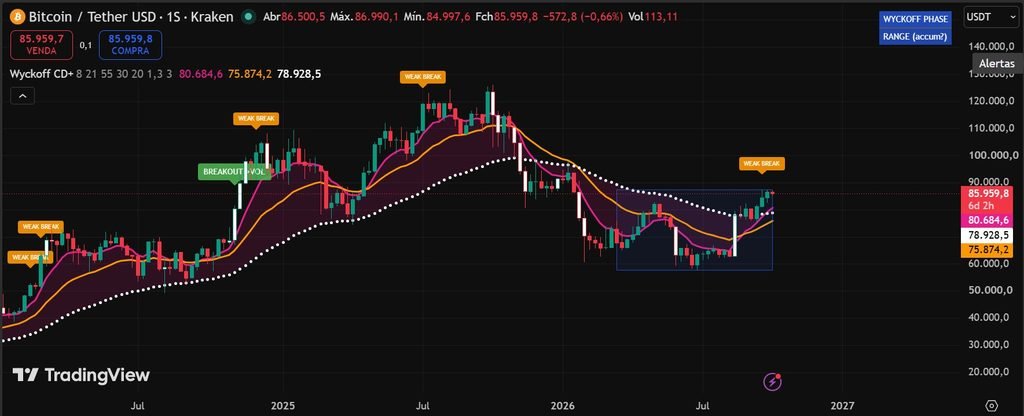
Image of the BTCUSDT chart with the Wyckoff CD + EMA indicator on TradingView.com.
1. What this indicator does
This indicator combines two layers of analysis in a single script:
The Wyckoff cycle layer:
- Accumulation range box: a blue box drawn over the current sideways range, marking the zone where big money may be positioning.
- Spring detection: a “SPRING ▲” label when the price briefly breaks below the range low and snaps back inside — Wyckoff’s classic last shakeout before takeoff.
- Volume-confirmed breakout: a “BREAKOUT +VOL” label when the price breaks the range top with volume well above average — the signature of big money pushing the price.
- Weak breakout warning: a “WEAK BREAK” label when the breakout happens without volume, which usually fails.
- Volume highlight: candles with volume 30%+ above the 20-bar average are painted white.
The trend context layer (EMAs):
- EMA 8 (pink), EMA 21 (orange), EMA 55 (white dots): a triple moving average system that reads trend direction, with the price testing the averages as support or resistance.
- Trend band: a soft shaded band between the fast and slow EMAs, showing the trend channel at a glance.
Everything works on any symbol and any timeframe. The method shines on higher timeframes (weekly, daily), where real accumulation structures form cleanly.
2. Installation
- Open your chart on TradingView (for example BTC/USD).
- Open the Pine Editor panel at the bottom of the screen.
- Delete any sample code and paste the full script.
- Click Save, give it a name (suggestion: “Wyckoff CD+”), then click Add to chart.
- The EMAs, the range box, the labels and the phase panel appear immediately.
To reuse it later, find it under Indicators > My scripts.
3. Settings
| Setting | Default | What it controls |
|---|---|---|
| Fast EMA length | 8 | The fast trend line (pink) |
| Mid EMA length | 21 | The middle trend line (orange) |
| Slow EMA length | 55 | The slow anchor line (white dots) |
| Show EMAs | On | Turns the three EMAs on or off |
| Fill band between fast and slow EMA | On | Shaded trend channel between EMA 8 and EMA 55 |
| Range lookback (bars) | 30 | How many bars define the sideways range |
| Volume average length | 20 | Period of the volume average |
| Volume spike multiplier | 1.3 | What counts as high volume (1.3 = 30% above average) |
| Max bars below range for spring | 3 | How many bars the price may stay below the range and still count as a spring |
| Show accumulation range box | On | Turns the blue range box on or off |
| Highlight high-volume candles | On | Paints high-volume candles white |
Recommended values by timeframe:
| Timeframe | Range lookback | Notes |
|---|---|---|
| Daily | 30 | About 6 weeks of range |
| Weekly | 30 | About 7 months of range — the sweet spot for this method |
| 4 hour | 40–60 | Wider lookback to filter noise |
Note: 8, 21 and 55 are Fibonacci numbers, which is why they were chosen for the EMA system.
4. Reading the chart
The EMAs:
- In an uptrend, the price rides above the three lines, and each pullback into the EMAs (8 first, then 21, then 55) tends to find support — potential entry or add-on zones.
- In a downtrend, the same levels act as resistance.
- When the three lines tangle together and the price chops through them, the market is sideways — exactly where Wyckoff ranges form.
The range box (blue):
- Drawn over the current sideways range when the market is contained.
- The top of the box is the breakout trigger; the bottom is the stop reference.
- The box follows the most recent bars — it shows the range that is active now, not historical ones.
The labels:
| Label | Meaning | Placement |
|---|---|---|
| SPRING ▲ | Price dipped below the range low and recovered within a few bars — the classic last shakeout before the markup | Below the candle |
| BREAKOUT +VOL | Price broke the range top with volume 30%+ above average — the official start of the markup phase | Above the candle |
| WEAK BREAK | Breakout without volume — usually fails | Above the candle |
White candles: volume at least 30% above the 20-bar average. In accumulation, look for white candles appearing on down moves that fail to break the range low — big money holding the floor.
5. Reading the WYCKOFF PHASE panel
The panel in the top-right corner shows the current phase:
| Panel text | Color | Meaning |
|---|---|---|
| UPTREND (EMAs) | Green | EMA 8 > EMA 21 > EMA 55. Trend phase — look for pullback entries, not range trades. |
| DOWNTREND (EMAs) | Red | EMA 8 < EMA 21 < EMA 55. Markdown phase — shorts only, or stay out. |
| RANGE (accum?) | Blue | Price contained in a sideways range. Potential accumulation — watch for the spring and volume. |
| MIXED | Blue | EMAs tangled and no clean range. No trade. |
6. Trading rules (suggested workflow)
- Read the context first: check the panel. Only look for longs when the context is turning up or the range sits at the bottom after a decline.
- Find the range: wait for the blue box. A range that appears after a downtrend is a potential accumulation.
- Watch the volume: inside the range, white candles on failed down moves are the strongest accumulation signal.
- Wait for the trigger: either a SPRING ▲ (the fake breakdown) or a BREAKOUT +VOL (the confirmed escape). Do not buy while the price is still sideways.
- Enter: on the breakout, or on the first retest of the broken ceiling — the retest is usually the safer entry.
- Place the stop: just below the range box (or below the spring low). If the price falls back inside the box, the setup failed — exit with a small loss.
- Manage the trend: once in profit, use the EMA pullbacks (8 and 21) as add-on zones and trail your stop below the EMA 55 or the range box, whichever is higher.
- Risk 1% to 2% of the account per trade. Skip MIXED phases entirely.
7. Alerts
The script includes three ready-to-use alerts (right-click the indicator > Add alert):
| Alert | Fires when |
|---|---|
| Wyckoff Breakout | Price breaks the range high with high volume |
| EMA Bullish Stack | The three EMAs align upward (8 > 21 > 55) |
| EMA Bearish Stack | The three EMAs align downward (8 < 21 < 55) |
The EMA stack alerts tell you when a new trend phase is starting; the breakout alert tells you when a specific range escape is confirmed.
8. Important notes
- This indicator is a decision-support tool, not an automatic signal generator. Always combine it with your own analysis and risk management.
- The range box shows the current range only; completed historical ranges are not drawn.
- Range detection uses a simple width filter (range size vs. ATR); in very volatile markets, adjust the lookback.
- Past behavior of any setup does not guarantee future results. Trading is high risk and most retail traders lose money.
9. Indicator Code
//@version=5
indicator("Wyckoff Cycle Detector + EMAs", shorttitle="Wyckoff CD+", overlay=true, max_lines_count=50, max_labels_count=100, max_boxes_count=50)

// ===== EMA inputs =====
ema8Len   = input.int(8,  "Fast EMA length", minval=1)
ema21Len  = input.int(21, "Mid EMA length", minval=1)
ema55Len  = input.int(55, "Slow EMA length", minval=1)
showEMAs  = input.bool(true, "Show EMAs")
showFill  = input.bool(true, "Fill band between fast and slow EMA")

// ===== Wyckoff inputs =====
rangeLen     = input.int(30,  "Range lookback (bars)", minval=10)
volLen       = input.int(20,  "Volume average length", minval=5)
volMult      = input.float(1.3, "Volume spike multiplier (1.3 = 30% above avg)", step=0.05)
springBars   = input.int(3,   "Max bars below range for spring", minval=1, maxval=10)
showRange    = input.bool(true, "Show accumulation range box")
showVol      = input.bool(true, "Highlight high-volume candles")

// ===== EMAs =====
ema8  = ta.ema(close, ema8Len)
ema21 = ta.ema(close, ema21Len)
ema55 = ta.ema(close, ema55Len)

p8  = plot(showEMAs ? ema8  : na, "EMA 8",  color=color.new(#E91E8C, 0), linewidth=2)
p21 = plot(showEMAs ? ema21 : na, "EMA 21", color=color.new(color.orange, 0), linewidth=2)
p55 = plot(showEMAs ? ema55 : na, "EMA 55", color=color.new(color.white, 0), linewidth=1, style=plot.style_circles)
fill(p8, p55, color=showFill ? color.new(#E91E8C, 92) : na, title="Trend band")

// Trend context from the EMAs
bullStack = ema8 > ema21 and ema21 > ema55
bearStack = ema8 < ema21 and ema21 < ema55

// ===== Volume condition =====
volAvg  = ta.sma(volume, volLen)
highVol = volume > volAvg * volMult

// ===== Range (accumulation box) =====
rangeHigh  = ta.highest(high, rangeLen)
rangeLow   = ta.lowest(low, rangeLen)
rangeSize  = rangeHigh - rangeLow
atrVal     = ta.atr(14)
isSideways = rangeSize < atrVal * 8

var box rangeBox = na
if showRange and isSideways and barstate.islast
    box.delete(rangeBox)
    rangeBox := box.new(bar_index - rangeLen + 1, rangeHigh, bar_index, rangeLow, border_color=color.new(color.blue, 30), bgcolor=color.new(color.blue, 92))

// ===== Spring detection =====
var int barsBelow = 0
if low < rangeLow
    barsBelow := barsBelow + 1
else if close > rangeLow and barsBelow > 0 and barsBelow <= springBars
    barsBelow := 0
    label.new(bar_index, low, "SPRING ▲", style=label.style_label_up, color=color.new(color.green, 15), textcolor=color.white, size=size.small, yloc=yloc.belowbar)
else
    barsBelow := 0

// ===== Breakout with volume =====
brokeUp = ta.crossover(close, rangeHigh[1]) and highVol
if brokeUp
    label.new(bar_index, high, "BREAKOUT +VOL", style=label.style_label_down, color=color.new(color.green, 10), textcolor=color.white, size=size.small, yloc=yloc.abovebar)

brokeUpNoVol = ta.crossover(close, rangeHigh[1]) and not highVol
if brokeUpNoVol
    label.new(bar_index, high, "WEAK BREAK", style=label.style_label_down, color=color.new(color.orange, 10), textcolor=color.white, size=size.tiny, yloc=yloc.abovebar)

// ===== Volume highlight =====
barcolor(showVol and highVol ? color.white : na)

// ===== Phase panel (EMAs + Wyckoff) =====
var table panel = table.new(position.top_right, 1, 2, border_width=1, border_color=color.new(color.white, 70))
if barstate.islast
    phaseTxt = bullStack ? "UPTREND (EMAs)" : bearStack ? "DOWNTREND (EMAs)" : isSideways ? "RANGE (accum?)" : "MIXED"
    phaseCol = bullStack ? color.new(color.green, 25) : bearStack ? color.new(color.red, 25) : color.new(color.blue, 35)
    table.cell(panel, 0, 0, "WYCKOFF PHASE", text_color=color.white, bgcolor=color.new(color.blue, 30), text_size=size.small)
    table.cell(panel, 0, 1, phaseTxt, text_color=color.white, bgcolor=phaseCol, text_size=size.small)

// ===== Alerts =====
alertcondition(brokeUp, "Wyckoff Breakout", "Price broke the range high with high volume")
alertcondition(bullStack and not bullStack[1], "EMA Bullish Stack", "EMAs 8/21/55 turned bullish")
alertcondition(bearStack and not bearStack[1], "EMA Bearish Stack", "EMAs 8/21/55 turned bearish")
Disclaimer:
These indicators are provided for educational purposes only and do not constitute financial advice. Trading is high risk and most retail traders lose money. Always do your own research and never invest money you cannot afford to lose.

