
The EMA 34 Wave setup uses three moving averages as a market clock. AI-generated image.
Introduction
Day trading crypto means opening and closing positions within the same day, riding short price swings instead of holding for months. It is one of the hardest ways to trade, because crypto moves fast and never sleeps. The difference between guessing and trading with a plan usually comes down to one thing: a simple, repeatable setup.
One of the most elegant setups comes from American futures trader Raghee Horner, who popularized what she calls the 34 EMA Wave: three exponential moving averages of 34 periods that work together like a compass for the market. This guide explains how the setup works, why the number 34 matters and how to apply it to Bitcoin and other cryptocurrencies.
What is day trading crypto?
Day trading is the practice of buying and selling within the same session, closing every position before the day ends. In crypto, where markets run 24/7, it usually means trading the most liquid hours and focusing on assets like Bitcoin and Ethereum, where spreads are tight and volume is deep.
Unlike long-term investing, day trading lives and dies by two things: a clear setup that tells you when the odds favor a trade, and strict risk management that keeps one bad trade from wiping out a week of gains. No indicator replaces those two pillars.
Meet the 34 EMA Wave
The setup uses three exponential moving averages, all with 34 periods:
- EMA 34 of the highs: the upper edge of the wave.
- EMA 34 of the closes: the middle line, the “heartbeat” of the trend.
- EMA 34 of the lows: the lower edge of the wave.
Together, the three lines form a channel, or “wave”, that hugs the price. When price rides above the wave, buyers are in control. When price sinks below it, sellers are. When price chops inside the wave, the market is undecided.
The beauty of the setup is that it filters noise without lagging too far behind price, which is exactly what a day trader needs.
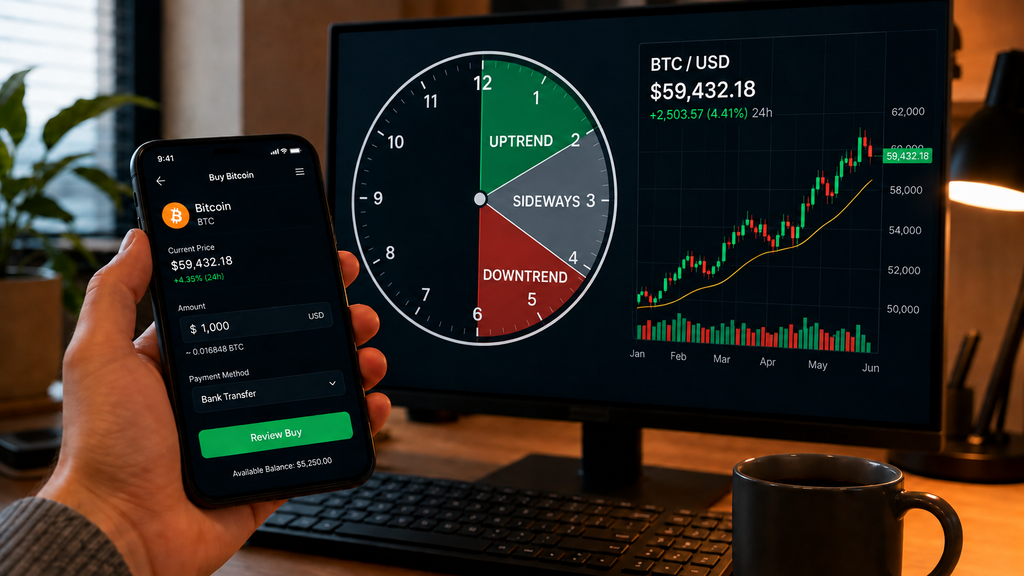
The market clock: rise between 12 and 2, sideways movement between 2 and 4, decline between 4 and 6. AI-generated image.
Why the number 34?
34 is a Fibonacci number, part of the sequence 1, 1, 2, 3, 5, 8, 13, 21, 34, 55. In moving averages, the choice of period is always a trade-off between speed and noise:
- Fast averages (8, 13): react quickly but whipsaw you with false signals.
- Slow averages (50, 100): filter noise but arrive late to the move.
- 34: sits in the sweet spot, responsive enough for intraday moves yet smooth enough to ignore most noise.
This balance is why the 34 period works on almost any timeframe, from 5-minute charts to daily charts, and why it has stayed popular among professional traders for decades.
The market clock
Raghee Horner compares the market cycle to the hands of a clock. As the wave bends and the price moves around it, the market passes through phases:
| Clock position | Market phase | What it means |
|---|---|---|
| 12 to 2 | Uptrend | Price above the wave, EMAs sloping up |
| 2 to 4 | Sideways | Price chopping inside the wave |
| 4 to 6 | Downtrend | Price below the wave, EMAs sloping down |
The clock keeps turning: after the downtrend comes a new base, and the cycle repeats. The day trader’s job is to trade the phases that pay (the trends) and sit out the phase that bleeds accounts (the chop).

Two investors at home discussing the setup: a tablet showing the wave chart with the pullback entry highlighted, and a wall-mounted monitor displaying the trading plan (“ENTRY”, “STOP”, “TARGET”, “1-2% RISK”). AI-generated image.
How to trade the setup in practice
- Set your timeframes. Use the 15-minute or 1-hour chart for context and the 5-minute chart for entries. The wave should be read on the higher timeframe first.
- Identify the phase. Price above the wave with the EMAs sloping up is the 12-to-2 phase. Only then look for longs.
- Wait for the pullback. In an uptrend, wait for price to dip into the wave channel and reject it, closing back above the EMA of the highs.
- Enter on the rejection. Enter long when the candle closes back above the wave, ideally with volume confirming the move.
- Place the stop below the wave. A close below the EMA of the lows invalidates the idea. Risk a fixed percentage per trade, commonly 1% to 2% of the account.
- Take profits at structure. Target the next resistance level or use a fixed reward-to-risk ratio of at least 2:1.
- Skip the chop. When price is inside the wave (the 2-to-4 phase), there is no trade. Waiting is a position.
Risk management comes first
- Risk 1% to 2% per trade. With a 2:1 reward-to-risk ratio, you can be wrong more often than right and still grow.
- Respect the daily stop. Two or three losses in a day means the market is in chop. Close the platform.
- Size for volatility. Crypto swings are wider than stocks. A stop that is too tight gets hit by noise.
- Beware of news spikes. Scheduled events can gap through stops. Know the calendar before you trade.
Common mistakes to avoid
- Trading every phase of the clock instead of only the trending ones.
- Moving the stop loss when the trade goes against you.
- Using the setup on illiquid coins where the wave means little.
- Overtrading after a win, or revenge trading after a loss.
- Ignoring fees and spreads, which eat small intraday profits faster than most beginners expect.
FAQ
Is day trading crypto profitable? It can be, but most day traders lose money. A repeatable setup plus strict risk management is what separates the consistent minority from the rest. Treat it as a skill that takes months to develop, not a shortcut.
What timeframe works best for the 34 EMA Wave? The setup adapts to any timeframe. For day trading, a common combination is the 1-hour chart for context and the 5-minute or 15-minute chart for entries.
Can I use this setup on any exchange? Yes. The setup is universal: it works on any platform with candlestick charts, including Kraken, Binance, Coinbase and TradingView.
Do I need the indicator installed? No. You can add three EMAs of 34 periods (on high, close and low) manually on any chart. The Pine Script below automates the drawing and colors the market phases for you.
Disclaimer:
This article is for educational purposes only and does not constitute financial advice. Day trading is high risk and most retail traders lose money. Cryptocurrency markets are highly volatile. Always do your own research and never invest money you cannot afford to lose. This article may contain affiliate links: if you purchase through them, we may receive a commission at no additional cost to you.

