
Each candlestick tells a story about buyers and sellers. AI-generated image.
Introduction
Every price chart is built from candles, and each candle tells a small story about buyers and sellers. Learning to read candlestick patterns is one of the most useful skills in technical analysis, because it shows the battle between demand and supply in a single glance.
This guide explains how to read a candle, the most important patterns to recognize and how to combine them with support and resistance for better decisions.
How to read a single candle
Each candlestick shows four pieces of information for a given period:
- Open: the price when the period started.
- Close: the price when the period ended.
- High: the highest price reached.
- Low: the lowest price reached.
The thick part of the candle, called the body, shows the distance between open and close. The thin lines above and below, called wicks or shadows, show the high and low.
A green (or white) candle means the close was higher than the open: buyers won the period. A red (or black) candle means the close was lower than the open: sellers won.
The body shows the distance between the open and close; the wicks show the high and low. AI-generated image.
Why candle size matters
- Long body: strong conviction. A long green candle shows aggressive buying; a long red candle shows aggressive selling.
- Small body: indecision. Buyers and sellers are roughly balanced.
- Long wicks: rejection. A long lower wick means buyers pushed the price back up from the lows; a long upper wick means sellers pushed it back down from the highs.
Context changes everything. The same pattern means different things at the bottom of a downtrend than at the top of an uptrend.
Key reversal patterns
These patterns suggest the current trend may be losing strength:
| Pattern | What it looks like | What it suggests |
|---|---|---|
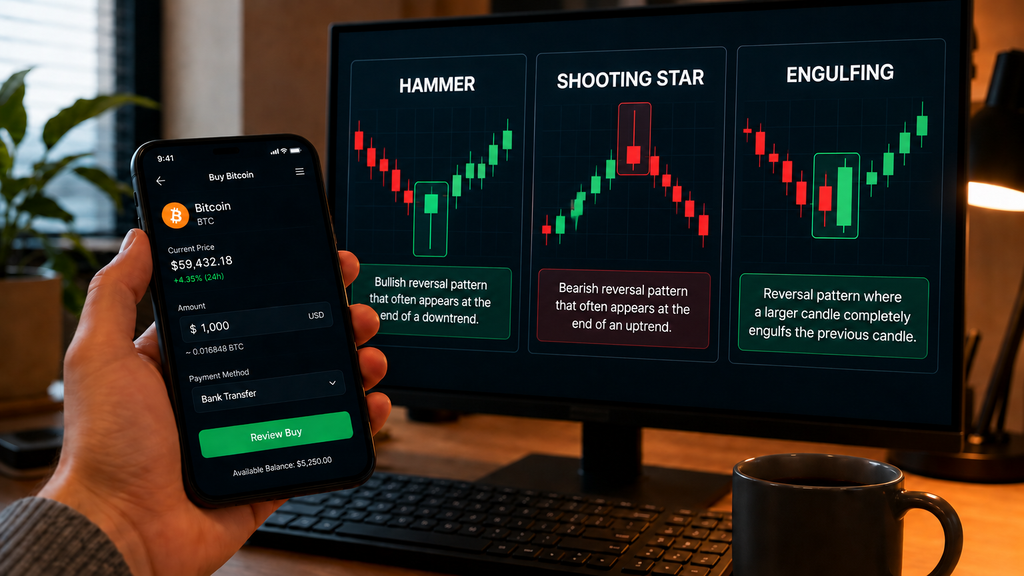
| Hammer | Small body, long lower wick after a decline | Buyers stepping in, possible bottom |
| Shooting Star | Small body, long upper wick after a rise | Sellers stepping in, possible top |
| Bullish Engulfing | Large green candle covering the previous red one | Buyers taking control |
| Bearish Engulfing | Large red candle covering the previous green one | Sellers taking control |
| Doji | Open and close almost equal | Indecision, possible turning point |

Reversal patterns signal that the current trend may be losing momentum. AI-generated image.
Key continuation patterns
These patterns suggest the current trend is likely to continue:
- Rising Three Methods: a strong green candle followed by small pullback candles, then another strong green candle. A pause, not a reversal.
- Falling Three Methods: the mirror image in a downtrend.
- Three White Soldiers: three consecutive strong green candles with small wicks, showing steady buying pressure.
- Three Black Crows: three consecutive strong red candles, showing steady selling pressure.
How to use candlestick patterns in practice
- Never read a pattern in isolation. A hammer at a major support level is far more meaningful than a hammer in the middle of nowhere.
- Combine with support and resistance. Patterns at key levels give the strongest signals.
- Wait for confirmation. Let the next candle close before acting on a pattern.
- Check the volume. A reversal pattern with high volume carries more weight than one on low volume.
- Use higher timeframes for context. A pattern on the daily chart matters more than one on a five-minute chart.
Common mistakes to avoid
- Treating every pattern as a guaranteed signal. They are probabilities, not certainties.
- Ignoring the trend and the level where the pattern appears.
- Trading patterns on very low timeframes, where noise dominates.
- Forgetting risk management. No pattern replaces a stop loss.
FAQ
Are candlestick patterns reliable? They improve your odds by showing shifts in buying and selling pressure, but they are not guarantees. Always combine them with levels, volume and trend context.
Which timeframe is best for candlestick patterns? Higher timeframes like the daily chart produce more reliable signals. Lower timeframes have more noise and more false signals.
What is the difference between a wick and a body? The body shows the distance between open and close. The wicks show how far the price traveled beyond that range during the period.
Do candlestick patterns work in crypto? Yes. Crypto markets are volatile and emotional, which makes candlestick psychology especially visible. Use zones and confirmation, as false signals are common.
Disclaimer:
This article is for educational purposes only and does not constitute financial advice. Cryptocurrency markets are highly volatile. Always do your own research and never invest money you cannot afford to lose. This article may contain affiliate links: if you purchase through them, we may receive a commission at no additional cost to you.

