Every market moves in cycles. Prices do not rise forever, and they do not fall forever. They repeat the same rhythm, over and over: expansion, peak, contraction, trough, and back to expansion. Learning to read this rhythm is the difference between buying at the top out of euphoria and buying at the bottom while everyone else panics.

Investor working from home with a “MARKET CYCLES” diagram on the monitor. AI-generated image.
The market clock
Think of the market as a clock with four positions. At the top you have the peak, where prices are high and everyone is excited. From there the clock moves down through contraction, where prices fall and fear grows. At the bottom sits the trough, where prices are low and nobody wants to buy. Then the clock rises again through expansion, where prices climb and confidence returns, until it reaches a new peak.
This is the macro cycle that governs stocks, crypto, commodities and real estate. It does not tick on a fixed schedule, but the sequence is always the same. The skill is not predicting the exact day of a turn, it is knowing which phase you are in and acting accordingly.
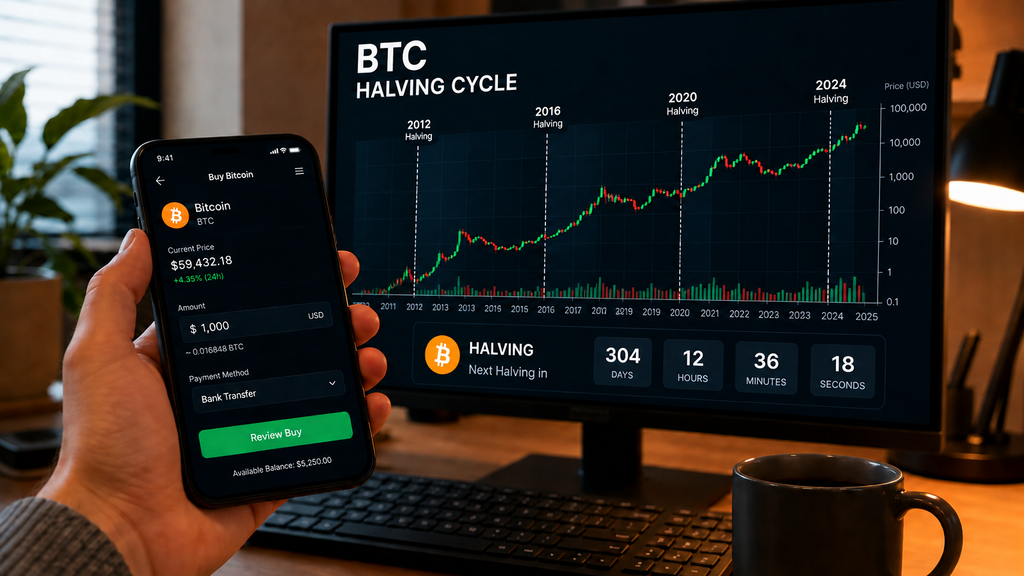
Bitcoin 4-year cycle chart with the 2012, 2016, 2020, and 2024 halvings marked. AI-generated image.
The Bitcoin four-year cycle
In crypto, the macro clock has a powerful engine: the Bitcoin halving. Roughly every four years, the reward for mining a Bitcoin block is cut in half, which reduces the supply of new coins entering the market. Historically, each halving has marked the beginning of a new expansion phase, followed by a peak and then a contraction.
The halvings happened in 2012, 2016, 2020 and 2024. In each cycle, Bitcoin and the broader crypto market followed the same pattern: accumulation before the event, a strong rally after it, a euphoric peak, and then a deep correction. Understanding this rhythm helps you see why patience matters in crypto and why buying during the trough, when sentiment is terrible, has historically been the best risk-reward moment.

Investor analyzing a chart related to the economic cycle. AI-generated image.
The sentiment cycle
Prices and emotions move together. At the trough, fear is at its maximum: headlines are negative, investors are selling, and nobody wants to touch the asset. At the peak, greed takes over: everyone is buying, the news is euphoric, and risk is forgotten.
The famous Fear and Greed Index captures this in a single number. When the index is deep in fear, it often marks good buying zones. When it is extreme greed, it often marks distribution zones. The index is not a timing tool on its own, but it is a useful check on your own emotions, which are the biggest enemy of cycle investing.

Two investors discussing cycles with a FEAR/GREED sentiment panel. AI-generated image.
Where Wyckoff fits
The Wyckoff method we covered in our Wyckoff Cycle guide is the fine reading of this same clock. The macro cycle and Wyckoff’s four phases describe the same movement from two angles:
- Trough matches Wyckoff’s accumulation: the sideways range at the bottom where smart money builds positions.
- Expansion matches markup: the breakout and the rising trend.
- Peak matches distribution: the sideways range at the top where smart money sells.
- Contraction matches markdown: the falling trend back to the next trough.
The macro cycle tells you the big picture; Wyckoff tells you where exactly the turn is happening. Together they form a complete map: the clock shows the season, and Wyckoff shows the exact day.
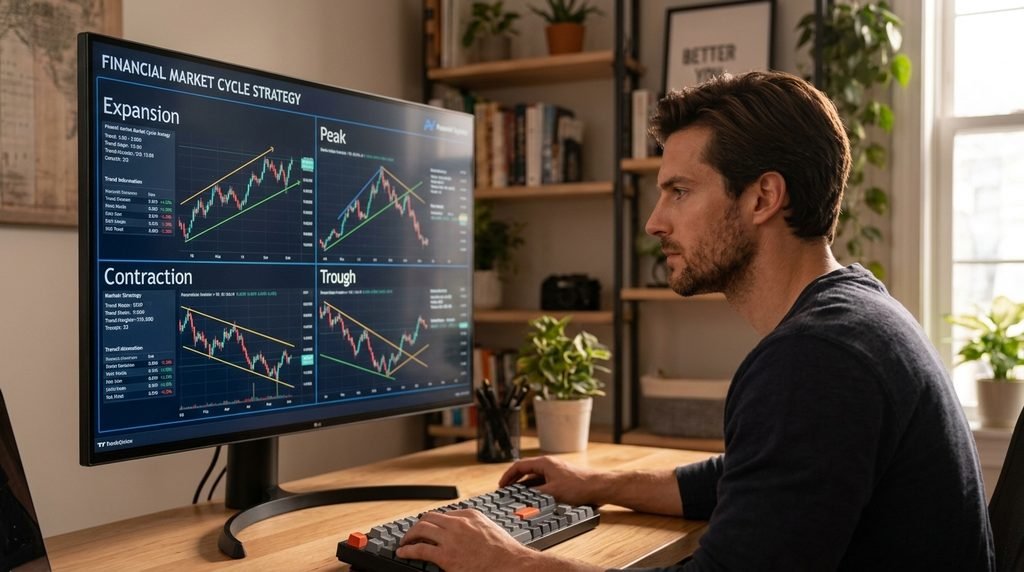
Monitor displaying the phase-based strategy dashboard: EXPANSION “HOLD & ADD,” PEAK “TAKE PROFIT,” CONTRACTION “CASH & WAIT,” and TROUGH “ACCUMULATE.” AI-generated image.
How to operate each phase
Each phase calls for a different behavior:
- Expansion: hold your positions and add on pullbacks. The trend is your friend; do not fight it.
- Peak: take profits gradually. Euphoria is the signal to reduce risk, not to increase it.
- Contraction: move to cash and wait. Fighting a downtrend is how accounts get destroyed.
- Trough: accumulate gradually while fear is high. This is where the best risk-reward of the whole cycle lives.
The hard part is not knowing these rules, it is following them when your emotions push the other way. That is why a systematic approach matters.
How this connects with our tools
Our free indicators help you stay on the right side of the clock. Use the 34 EMA Wave to confirm the trend direction in expansion and contraction, and the Wyckoff Cycle Detector to spot the accumulation and distribution ranges where the cycle turns. The clock tells you the season; the indicators tell you the day.
Disclaimer:
This article is for educational purposes only and does not constitute financial advice. Investing and trading are high risk and most retail investors lose money. Always do your own research and never invest money you cannot afford to lose.

